You probably didn’t need to see a comprehensive report to know that 2022 was a tough year in sheltering. But we do have the data, thanks to Shelter Animals Count. Here’s their newest report: Intake and Outcome Data Comparison for the Full Year, Q1-Q4 2022.
The long and short of it is that by most metrics, 2022 was worse than 2021, but still significantly better than 2019. While encouraging you to read the whole report, some of the most important and salient data points and findings include:
- 2.7 percent more pets entered shelters in 2022 than in 2021—but this is 15.6 percent less than in 2019. To avoid double counting, SAC also measures community intakes—i.e., the number of pets entering shelters at the state, regional, or national level. Community intakes of cats and dogs were up 4.3 percent in 2022 over 2021. They’re down 15.5 percent from 2019.
- Shelter euthanasia is up by 1 percentage point in 2022 over 2021—in 2022, shelter euthanasia was 8.2 percent of all intakes, while it was 7.2 percent in 2021. This is lower than before the pandemic. In 2019, shelter euthanasia accounted for 10.6 percent of intakes.
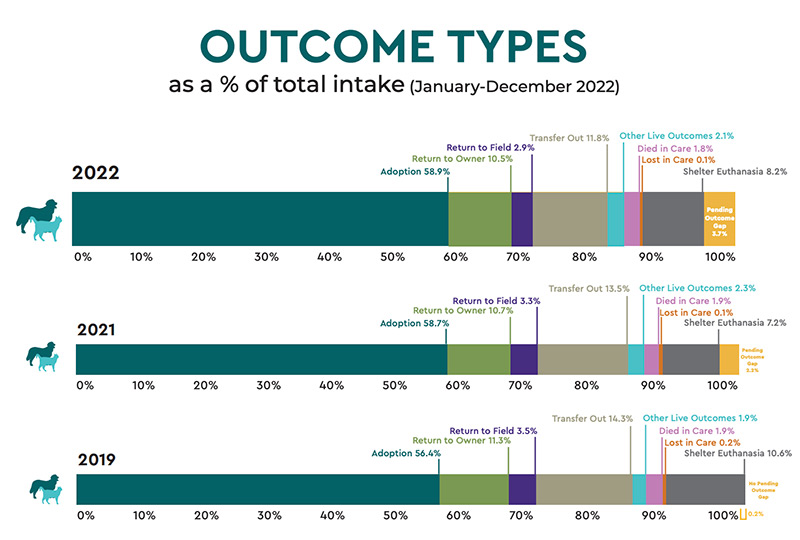
- Looking at the outcome types graphic above, you can also see that transfers between shelters and other organizations have gone down. In 2019, 14.3 percent of cats and dogs were leaving shelters as transfers. In 2021, that number was 13.5 percent. In 2022, it was 11.8 percent.
- 1.1 percent more cats entered shelters in 2022 than in 2021. Compared to 2019, 14 percent fewer cats are entering shelters.
- 7.9 percent more dogs came into shelters in 2022 than in 2021. This is 17.1 percent less than in 2019.
- The percentage of pets coming into shelters as owner surrenders has held remarkably steady: In 2022, that number was 24.9 percent. In 2021, it was 25.2 percent. In 2019, it was 24.8 percent.
- Stray intake for cats and dogs measured together is also pretty steady: 49.6 percent in 2022, 48 percent in 2021, and 50.8 percent in 2019.
- But that changes when just looking at dogs: Stray intakes increased as a percentage of total intakes for dogs in 2022 than in 2021, and that number is slightly higher than 2019, as well. That’s 48.7 percent for 2022, 45.6 percent in 2021, and 48 percent in 2019.
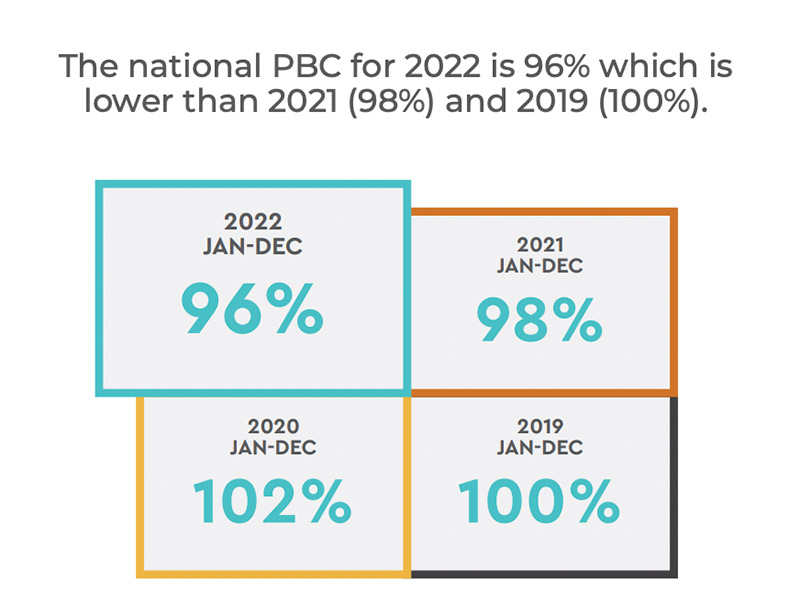
- More pets entering shelters were staying there in 2022 over 2021. In 2019, according to the SAC data, 100 percent of the pets coming into shelters had (live or not live) outcomes.
Being desperately seeking silver lining kinds of people, we reached out to SAC’s Executive Director Stephanie Filer to discuss where there’s room for hope in this data—and what the data tells us about where new efforts can make a big difference:
- Stephanie tells us she’s finding a lot of hope in how promising these numbers are for cats. Not only because it means that the huge efforts that have been put into saving cats’ lives through community cat programs, and otherwise, are working—but also because if we can do it for cats, that strongly indicates we can also do it for dogs.
“Let’s keep the momentum for cats, and let’s now bring up dogs to that same level,” Stephanie says. “We know that we can, in a lot of ways, influence or control these outcomes.”
➡️ Don’t forget to use the Big Dogs communications kit, created by HASS and HeARTs Speak!
- There’s a strong call to action for members of the public to get involved with their local shelter, in all the usual ways: adopting, fostering, donating, and volunteering. “We saw through surveys last year that organizations really need more people—especially volunteers and staff,” Stephanie says.
➡️ And two more communications kits for you to use: Volunteer Integration and Fostering. Check out these blogs, too: 8 Ways to Recruit Volunteers and Keep Them Engaged, Why Is It So Hard to Volunteer to Help Pets?, 6 Tips for Building a Barrier-Free, Inclusive Foster Base, and How One Shelter Recruited 2,000 Fosters in a Year and a Half.
- Given that so many pets coming into shelters as “strays” are actually pets who’ve wandered away from home, does the data indicate that more efforts and resources could and should be put into lost pet reunification? Yes, especially when looked at in conjunction with the flat return to owner rate.
➡️ Guess what? We’ve got another communications kit for you—Lost Pet Reunification—plus this blog: 5 Kits, Infographics, and Tools to Get More Lost Pets Back Home to Their Families. Stay tuned for more game-changing info about lost pet reunification; it’s coming soon.
- The dip in transfers obviously isn’t great news for shelters—but is another area where focused efforts could yield meaningful results. Step one: communicating with rescues and other potential transfer partners to learn why they aren’t taking in as many of your pets, and trying to help solve whatever problems are standing in the way.
➡️ We’ve got more blogs to help you here, too: How This County Shelter Is Still Sending About Half Its Pets to Transfer Partners, Lifesaving Paw-tnerships: How to Build and Sustain Healthy Relationships Between Rescues and Shelters, 10 Tips ALL Source Shelters Should Know for Successful Transfer Partnerships, and 10 Tips ALL Destination Shelters Should Know for Successful Transfer Partnerships.
- Finally, the data, but not only the data, shows a continued need for more, and more robust, pet support services that help pets who are already in homes. We can assume that this support will prevent some pets from coming into shelters, and will certainly keep those in homes safer. Stephanie tells us SAC is preparing a report on community services, which should be released in the coming months. We can’t wait to see what it says.
➡️ We have a lot of materials on how to start and run pet support programs, on the HASS website. Here are a few helpful links, but please browse and search the whole site for more, especially the Pro Resources section where you will find industry resources for supporting both ends of the leash: You Want to Help Keep People and Pets Together. But How to Get Started?, the Keeping Families Together Eviction Response toolkit, With pets.findhelp.com, Pet Support Is Just A Click Away!, Getting Started with Ecosystem Mapping, and a year’s worth of communications kits plus a communications calendar.
➡️ Also, check out this Q&A with National Shelter Support Director Jordana Moerbe about how your organization can get help with *essentially anything*, including adoptions, fostering, medical care, transfer relationships, and starting and running pet support programs.
Stephanie says that most of all, she wants to get out the message that this report shows urgency, and that the time to act is right now.
“This report not only validates the experience that animal welfare professionals have had over the past 4 years, it also provides an invaluable insight into the trends that we can expect to continue throughout 2023 unless there is a significant intervention to change the trajectory of too many pets staying behind in shelters as more pets are added each day,” she says.
“Fortunately, there are many paths to closing this population imbalance, but the data indicates that the most impactful thing organizations can do right now is to increase outcomes for the animals who are still in their care—and fast. If we wait until Q2, we have 4 years of trends to show us that will be too late.”
We want to hear from you! Please reach out at marketing@americanpetsalive.org to tell us about what you’re doing to help pets get and stay in homes, and keep pets and people together.